The GBP/USD currency pair also declined sharply on Tuesday, which many view as the start of a new cycle of US dollar strength amid the lack of an agreement between Iran and the US. In our opinion, this is not the case at all.
First, it should be understood that even if the dollar lacks any growth factors, it does not mean it will fall every day. Second, individual geopolitical events and news can occasionally strengthen the US currency. Third, the character of the GBP/USD pair's movement in recent weeks resembles a "roller coaster." The price is constantly tossed around, making Tuesday's decline insignificant. Fourth, long-term trends remain upward, so we expect only growth for the British currency. Fifth, the geopolitical factor has an expiration date, and in the case of the Middle Eastern conflict, that date is nearly up. It is worth noting that the Middle East conflict is not the only conflict in the world over recent years and decades, nor is it the only one to have significantly impacted the energy market. As time passes, the world learns to live in a new reality.
Thus, the first thing to note is that the dollar still lacks reasons for prolonged growth. The Bank of England may raise the key rate at its next meeting alongside the European Central Bank. The Federal Reserve is very unlikely to implement any form of monetary tightening in 2026. Donald Trump's policies, in and of themselves, are already a significant reason to sell the dollar. The trade war is not over. The US economy is growing more weakly under Trump than it did under Joe Biden. Therefore, what basis is there to expect long-term growth for the US currency? It can also be added that the upward trends on the daily and weekly timeframes remain intact, and Trump sees a cheap dollar as the solution to all of the US's problems.
While the British pound also has very few reasons for growth, it continues to appear much more attractive in the long term than the dollar. It should also be understood that cycles exist in the market. The US dollar rose for about 15-16 years against its main competitors. It cannot continue to grow indefinitely. A new cycle presumably began in 2022, which Trump effectively supported. Thus, we view the decline of the British pound on Tuesday as a common pullback within the framework of a nearly sideways movement.
Of course, if the war in the Middle East resumes, one could expect a new strengthening of the US currency. But it would not be strong enough to break global trends. Thus, the dollar could strengthen to 1.3367. For this, it would not even need substantial reasons—just a typical technical correction. However, after the correction finishes, the trend will resume. Even another political crisis in the UK will not matter, as everyone has grown accustomed over the past 10 years to the fact that no Prime Minister stays at 10 Downing Street for long.
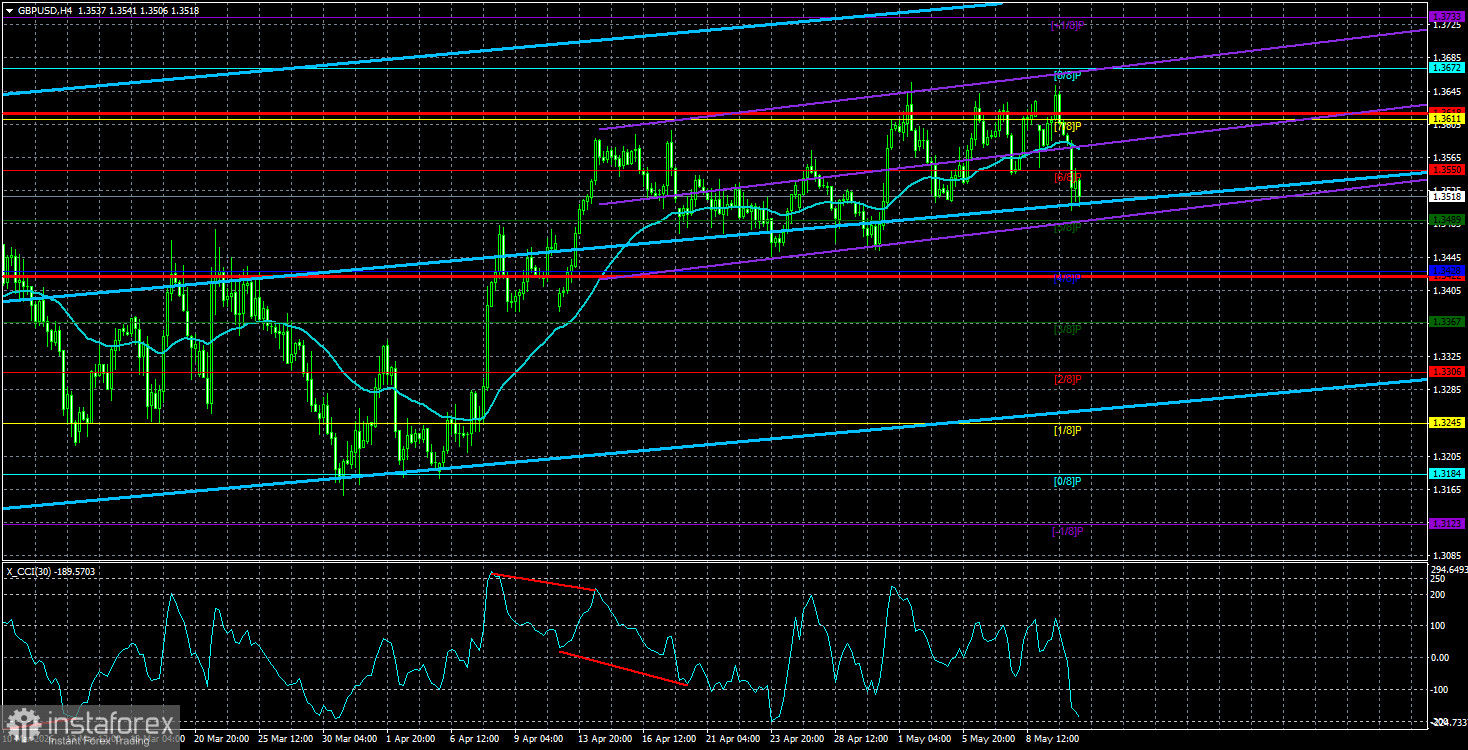
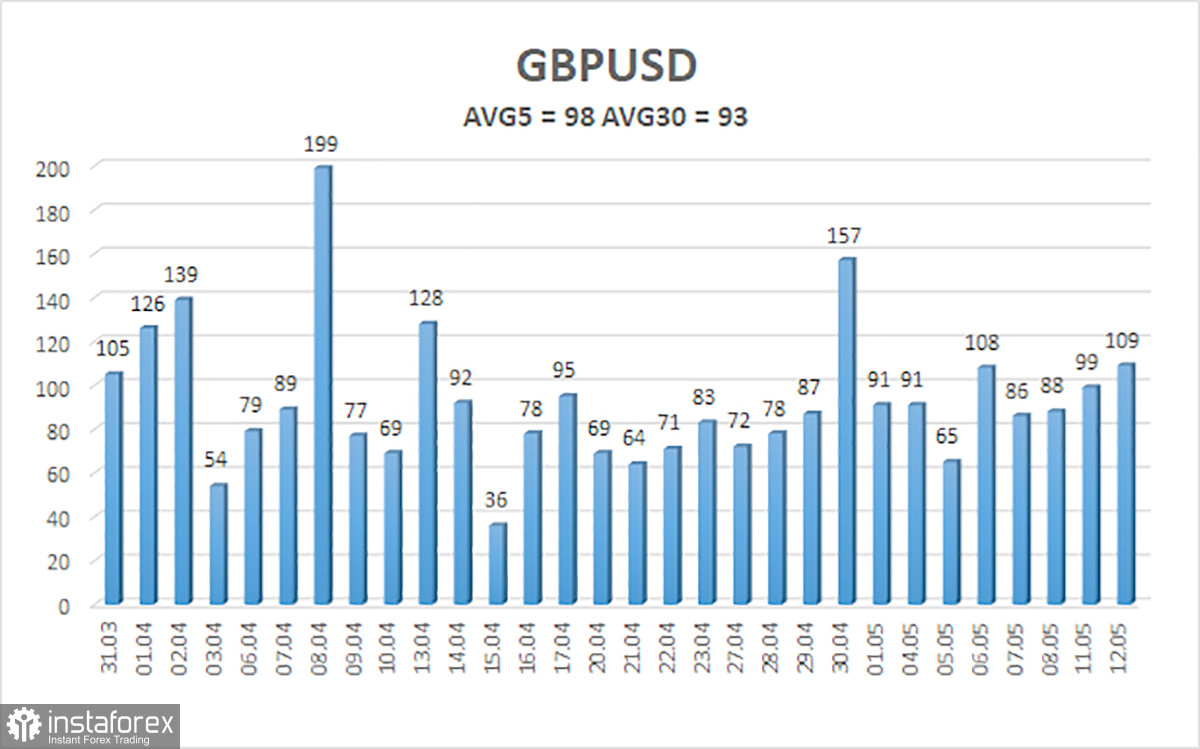
The average volatility of the GBP/USD currency pair over the last 5 trading days is 98 pips, which is considered "average" for this pair. On Wednesday, May 13, we expect the pair to move within the range limited by the levels of 1.3422 and 1.3618. The upper channel of the linear regression has turned upward, indicating a recovery of the upward trend. The CCI indicator has not generated signals recently.
Nearest Support Levels:
S1 – 1.3489
S2 – 1.3428
S3 – 1.3367
Nearest Resistance Levels:
R1 – 1.3550
R2 – 1.3611
R3 – 1.3672
Trading Recommendations:
The GBP/USD currency pair continues its recovery after two months of geopolitical uncertainty. Trump's policies will continue to put pressure on the US economy, so we do not expect the US currency to grow in 2026. Therefore, long positions with a target of 1.3916 and above remain relevant when the price is above the moving average. If the price is below the moving average line, short positions can be considered with targets at 1.3489 and 1.3428 on technical grounds. In recent weeks, the British currency has recovered, and the influence of geopolitical factors on the market has decreased.
Explanations for the Illustrations:
- Linear Regression Channels help identify the current trend. If both are pointing in the same direction, it indicates a strong trend.
- The Moving Average Line (settings 20,0, smoothed) indicates the short-term trend and the direction in which trading should currently proceed.
- Murray Levels serve as target levels for movements and corrections.
- Volatility Levels (red lines) indicate the likely price channel in which the pair will trade over the coming days, based on current volatility metrics.
- CCI Indicator: Its entry into the oversold area (below -250) or the overbought area (above +250) signifies that a trend reversal in the opposite direction is approaching.